How to compare restaurant location costs
Start with the same concept and operating assumptions for each site. Change the costs that differ, then calculate the sales and orders each site would need to cover the entered costs.
The result makes a cost difference easier to understand. It cannot tell you how many people will buy.
Put both locations on the same footing
Use the same average order, food-cost percentage, other cost per order, and days open. Keep monthly staffing and owner pay visible. If a site needs a different staffing plan, enter that difference too.
Fictional example. Location A and Location B are labels, not evaluated properties. All amounts below are invented for teaching.
| Monthly cost entered | Location A | Location B |
|---|---|---|
| Rent and building costs | $6,000 | $10,000 |
| Staffing | $12,000 | $12,000 |
| Owner pay | $4,000 | $4,000 |
| Other operating costs | $4,000 | $4,000 |
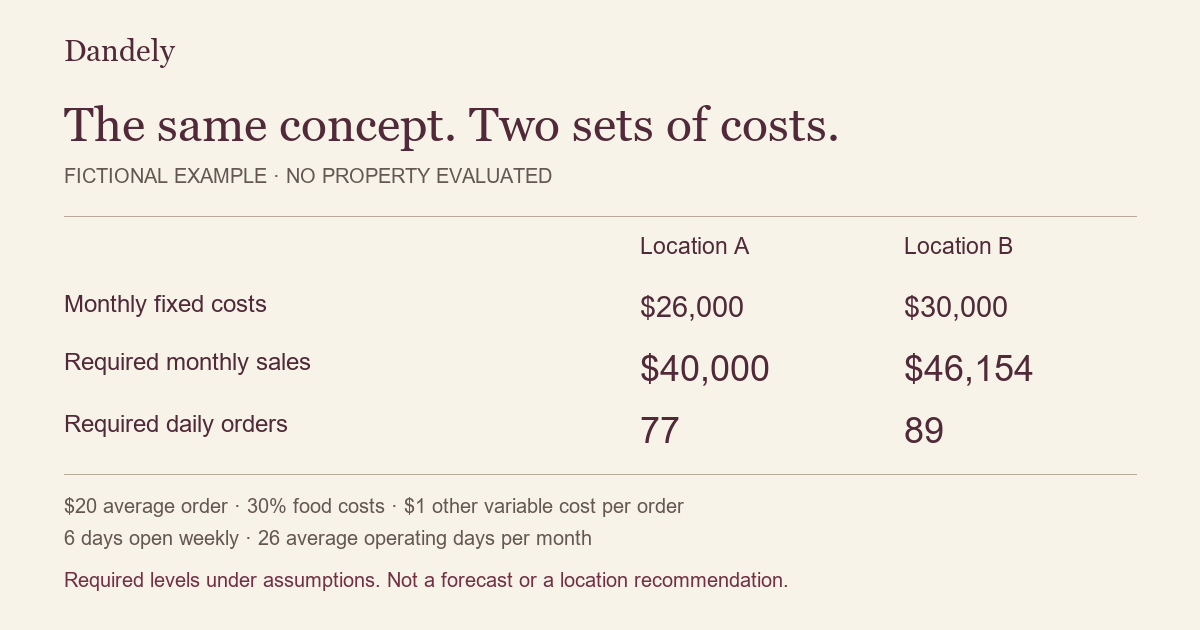
| Total monthly fixed costs | $26,000 | $30,000 |
For this example, those monthly costs stay fixed at the modeled volume. Real staffing, utilities, and lease charges can change with sales. Check how your own costs behave and avoid counting an expense twice.
| Shared assumption | Entered estimate |
|---|---|
| Average order | $20 |
| Food costs as a share of sales | 30% |
| Other variable cost per order | $1 |
| Days open each week | 6 |
These are teaching inputs, not restaurant benchmarks or suggested targets.
Follow one order through the calculation
A $20 order leaves $13 toward the entered monthly costs: $20 minus $6 in food costs minus $1 in other variable costs.
The model uses 52 ÷ 12 weeks per month. Six days open each week gives an average of 26 operating days per month. Actual calendar months and seasonal sales differ.
Required monthly orders = monthly fixed costs ÷ contribution per order.
Required monthly sales = unrounded monthly orders × average order.
Required daily orders = unrounded monthly orders ÷ average operating days per month.
| Required level under these assumptions | Location A | Location B |
|---|---|---|
| Monthly orders before display rounding | 2,000 | 2,307.6923… |
| Monthly sales, rounded to dollars | $40,000 | $46,154 |
| Orders per operating day, rounded upward | 77 | 89 |
Location B adds $4,000 in entered monthly costs. Under the shared assumptions, it requires about $6,154 more monthly sales. Compute differences from the unrounded amounts. The displayed daily counts differ by 12; the unrounded daily thresholds differ by about 11.83.
This does not make Location A the right choice. The calculation does not assess the reasons for Location B's higher costs or whether either site's required sales can be achieved.
Change one assumption and see what moves
Keep the same costs and change only average order to $18. Food costs remain 30%, other variable costs remain $1 per order, and the business stays open six days each week. Contribution becomes $11.60 per order.
| Required level with an $18 average order | Location A | Location B |
|---|---|---|
| Monthly sales, rounded to dollars | $40,345 | $46,552 |
| Orders per operating day, rounded upward | 87 | 100 |
More orders are needed because each order contributes less. The sales figure alone can hide that extra workload. A different average order may also change food costs, staffing, or service capacity; this example holds them constant to show one effect.
Check what the numbers leave out
- Confirm which lease charges belong in the occupancy estimate and which can change.
- Include owner pay and recurring costs you intend the model to cover.
- Identify payment, packaging, delivery, and other order-related costs without double counting them.
- Keep deposits, renovation, equipment, and other startup spending separate from monthly operations.
- Check permits, allowed use, property condition, access, and opening timing for the actual property.
- Ask how many orders the team and space can serve. This calculation does not establish capacity or demand.
With positive monthly fixed costs and zero or negative contribution per order, this model has no finite required-order threshold. Review the assumptions instead of treating a missing result as zero.
Prepare your own comparison
Use the location comparison checklist to gather consistent inputs. Then inspect the fictional sample to see how assumptions, alternative scenarios, and unanswered questions can sit together.
General education applies beyond the service area; the paid report has specific coverage boundaries.
Method and update notes
Prepared by Dandely on October 14, 2026. Fictional arithmetic checked using the formulas shown above. Dollars round to the nearest dollar; finite order thresholds round upward. Later figures use unrounded values. This is a simplified entered-cost model, not a complete accounting assessment or forecast.
For broader business planning, the U.S. Small Business Administration provides planning resources. Its planning materials do not validate these fictional inputs or either location.